How we got here
People have always collected information about themselves, others, and the world around us. More recently, we have developed many tools and devices to help us gather data in any number of ways. The number of variables we can analyze is almost infinite. Using increasingly standardized methods of data gathering allows us to compare variables and show how relationships between many variables change over time.
Science–in the modern sense of the word–uses data as a way of collecting and analyzing evidence. Data allows us to quantitatively compare information from a variety of sources.
Problems in data
Decreasing costs have increased the feasibility of adding sensors (devices that can collect information) to almost everything. On one hand this could make everything “smarter”, but on the other, it creates a lot of mess.
Hardware runs on chips, which contain vulnerabilities. Therefore, as more devices in our everyday lives produce more data to tell us more, we must be aware that we open ourselves up to having our data compromised (stolen).
Where does the future lead?
We will see more streams of data: data that never stops changing and updating. Streaming data is not static. It’s like a firehose: a constant flow of information. This is important to understand because it means that any feedback is almost instantaneous, but reflects only one instant in time. If you perform the analysis again a moment later, the result may be different.
The job of the future data visualizer will be to deal with this firehose of data and to figure out which parts are important in real time.
Examples and Code
D3.js
Site: d3js.org
Github: github.com/mbostock/d3
D3.js is the visualization library behind many of today’s interactive visualizations. It allows for deep control over all final interactions, but is also used as a building block for a number of other data tools.
Raphael.js
Site: raphaeljs.com
Github: github.com/DmitryBaranovskiy/raphael
Raphael and D3 are often interchangeable. Raphael, while not so complete an interactive library as D3, makes building charts and graphs easy.
Kimono
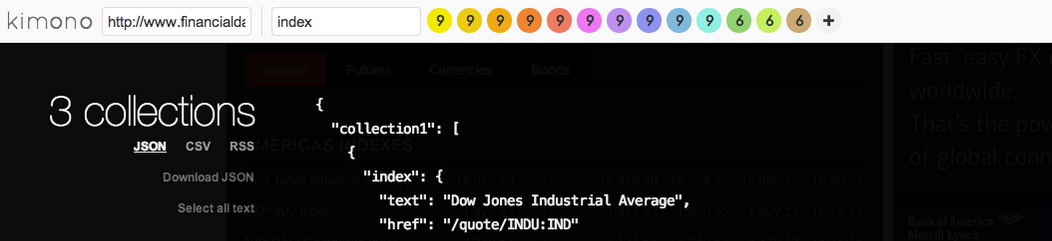
Site: KimonoLabs.com
Github: github.com/kimonolabs
Kimono acts as the database and scraper. Kimono has a powerful user interface that you can set to select parts of a web page, and then “scrape” it at set time intervals. Kimono then gives you access to the database in a static JSON file to work with.
Chart.js
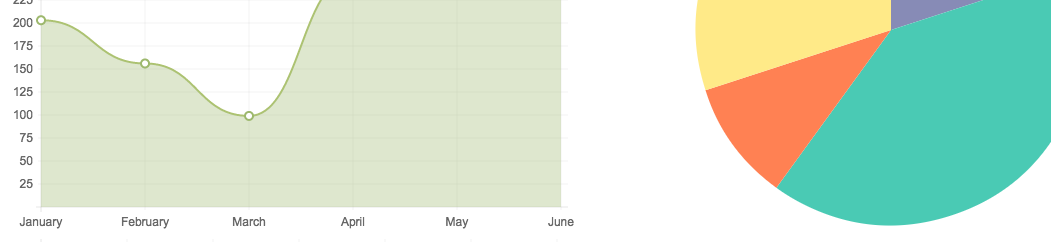
Site: chartjs.org
Github: github.com/nnnick/Chart.js
Chart.js is a library for getting charts up and running quickly. The goal of the library is to make it easy to create beautiful charts.
Chartbuilder
Site: quartz.github.io/Chartbuilder
Github: github.com/Quartz/Chartbuilder
Chartbuilder is an interface that makes it easy for anyone to type in data and have it displayed as a chart. This makes Chartbuilder one of the quickest ways to produce a chart if you already have your data ready to go.
Sheetsee.js
Site: jlord.us/sheetsee.js
Github: github.com/jlord/sheetsee.js
Sheetsee.js works together with Google Spreadsheets to allow you to convert a spreadsheet of data into interactive charts and maps.
Tabletop.js
Github: github.com/jsoma/tabletop
Like Sheetsee.js, Tabletop.js also using Google Spreadsheets as the database and then connects to your page to allow you to connect data to your interactive visuals.
- Tutorial
- Examples
Fusion Tables
Site: support.google.com/fusiontables/answer/2571232
Fusion Tables is Google’s tool that integrates with Spreadsheets to make creating visualizations simple.
- Tutorials
- Examples
SQL
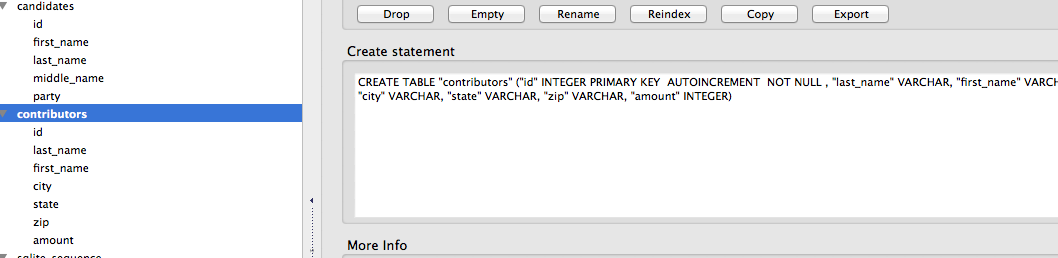
SQL stands for Structured Query Language, and is one of the more important pieces to the data journalism puzzle. SQL is a query programming language that allows you to use specific query terms to search a database. There are many types of databases that can hold different types of data, but SQL is one of the more popular ones due to it be fairly easy to use.
It is common to use SQL with relational databases like MySQL or SQLite. The power of SQL is being able to query a big set of data to discover relationships based on the questions you provide in the query language.
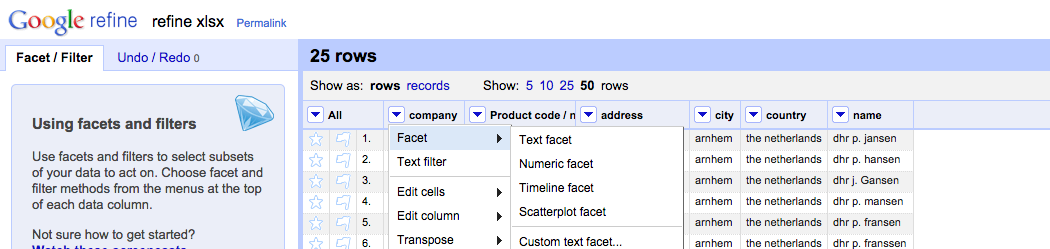
OpenRefine
Site: openrefine.org
Github: github.com/OpenRefine/OpenRefine
If you have lots of data, but need to clean it up so that you’re able to make use of it, OpenRefine is the tool you need. Cleaning data can be vary from triming extra whitespace characters, to updating titles and names with proper capitalization of a letter.
Formely known as GoogleRefine, OpenRefine also makes it easy to explore large data sets.
Other data links
Comparing Paper.js, Processesing.js, and Raphael.js
Differences between Raphael.js and D3.js
Flowing Data: learning R and visualizations
A Guide to Bulletproofing Your Data, Propublica
Data Will Help Us, brief manifesto on the promise and perils of data